DATA SCIENCE INTERVIEW QUESTIONS
PYTHON
1)Difference between List, Tuple, Set, Dict
- List:- l=[1,1,1,2,2,68,9,98,46]
Duplicates allowed, Order is imp
- Tupple:- Same as list except that is it immutable.
l[0]=7777// Error
- Set:- Order not imp, duplicates not allowed
- dict:- key,value pair, no duplicate key but value can be duplicate.
2)How to check armstrong number?
num = int(input("Enter a number: "))
sum = 0
temp = num
while temp > 0:
digit = temp % 10
sum += digit ** 3
temp //= 10
if num == sum:
print(num,"is an Armstrong number")
else:
print(num,"is not an Armstrong number")
3)Program to swap without using temporary variable?
x=5
y="greate"
x,y=y,x
print(x)
print(y)
FEATURE ENGINEERING & EDA
1)What is mean,median,mode?
Mean-->Average, Median-->Middle value, Mode-->Most repeated
2)Among mean,median which is not affected by outliers?
Median
3)Difference between nominal & ordinal encoding?
Nominal encoding is nothing but the features where variables have no order or rank to this variable's feature.
The different types of Nominal Encoding are
1)One Hot Encoding
2)One Hot Encoding with many categorical
3)Mean Coding
2)Ordinal Encoder:-
Ordinal Encoding is nothing but the feature where variables have some order or rank.

-->The different types of ordinal Encoding are 1)Label Encoding
2)Target guided ordinal Encoding.
4)Explain how to find outliers using box plot?
4)What is Inter Quartile Range?
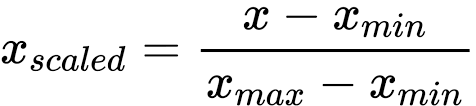
5)What is min max scaler?inMax scaler converts the data between 0 & 1 by using minmax formula.
-->Below is the formula of minmax scaler.
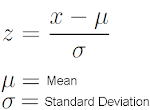
6)What is standard scaler?
Standard scaler converts the data values such that mean=0 & standard deviation=1.
STATISTICS
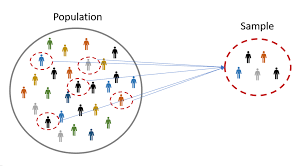
1)Difference betwenn population & sample?
Population & Sample:-
-->A population is the entire group that you want to draw conclusions about. Population is denoted by N
-->A sample is the specific group that you will collect data from. The size of the sample(n) is always less than the total size of the population(N). Sample is denoted by n.
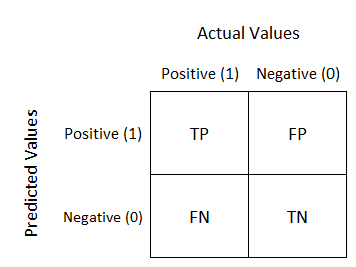
2)Explain confusion matrix?
A confusion matrix is used for evaluating the results of a classification machine learning model. where TN(True Negatives) - model predicts negative outcomes and the real/known outcome is also negative
TP(True Positives) - Model predicts positive outcome and the real outcome is also positive
FN(False Negatives) - model predicts negative outcome but known outcome is positive
FP(False Positives) - model predicts positive outcome but known outcome is negative
MACHINE LEARNING
1)Different types of machine learning algoritham?
Machine Learning is divided into 3 types
1)Supervised Machine Learning
2)Un Supervised Machine Learning
3)Reinforcement Machine Learning

1)Supervised Machine Learning:-Supervised Machine Learning has 2 types
1)Classification
2)Regression
Classification:-
-->Classification is a process of categorizing a given data into different classes.
-->Classification can be performed on both structured or unstructured data to categorize the data.
eg:-Classifying the mail whether it belong spam or not spam
Regression:- Regression models are used for prediction on a continuous value.
eg:-Predicting prices of a house given the features like size, price, area of location etc.
UN SUPERVISED MACHINE LEARNING:- Unsupervised machine learning is nothing but it uses machine learning algorithms to analyze the data and cluster the unlabeled datasets. Their are no dependent variable in Un Supervised Machine Learning
Un Supervised machine learning is divided into 2 types
1)Clustering
2)Dimensionality Reduction
1)Clustering:-
Clustering is the nothing but the dividing the population data into small number of groups such that data points in the same groups are more similar to other data points in the same group and dissimilar to the data points present in other groups.
eg:-I have a company & I want to release 2 products,1st product is costly so i want to target Rich people, 2nd product is a medium cost so i want to target middle class people. So when i am doing Add Marketing i can apply customer segmentation & can focus on that particular clusters
2)Dimensionality Reduction:-
When we have imbalance data i.e. for example 800 women & 200 men .When the new data point enters their is a high chances that the new data point may be grouped under women cluster .This is main problem with imbalance data. So by using dimensionality reduction concepts we will decrease or increase the data points.
2)What is the equation of line?
The linear line is given by the equation
y = mx + c+ error term
where
y=Dependent variable
x=Independent variable
m=co-efficient or slope
c=Intercept
3)What is overfitting & underfitting?
Overfitting:-
Overfitting is nothing but the with respect to training dataset getting low error & with respect to testing data getting high error & high variance. i.e. Our model performed well with training data & fails to perform well with test data.
Underfitting:-
Underfitting is nothing but getting high error with respect to both training dataset & testing dataset. i.e. our model Accuracy will be bad with respect to both training data & testing data
-->If we get low Bias & low variance then the model is called as Generalized model.
-->In simple words
Low bias & High variance-->Overfitting
High bias & High variance-->Underfitting
Low bias & Low variance-->Generalized Model
4)Ridge Regression is also called?
- Ridge regression is also called as L2 regularization.
5)Lasso Regression is also called?
- Lasso Regression is also known as L1 Regularization.
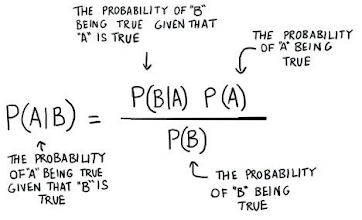
6)Naive Byes works on which therom?
Bayes Theorem:-
Naive Bayes algorithm is used for Classification, Which works on Bayes Theorem.The formula of the Bayes theorem is given below.
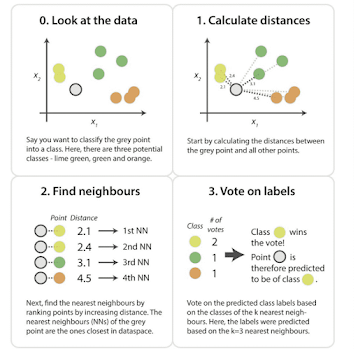
7)Explain KNN?
K-Nearest Neighbor (KNN) is a supervised machine learning algorithm used for solving both classification and regression problems.
-->KNN algoritham is easy to implement
-->The major drawback of KNN Algoritham is it becomes slow when the size of the data is large.
8)Why we need to handle imbalance data?
mbalanced data refers to those types of datasets where the target class has an uneven distribution of observations, i.e. one class label has a very high number of observations and the other has a very low number of observations.
-->Their are two ways to handle imbalance data
1)By Under Sampling method
2)By Over Sampling method
9)Explain under sampling?
Under sampling is a technique to balance uneven datasets by keeping all of the data in the minority class and decreasing the size of the majority class.
eg:- If we have 900-->Yes & 100-->No in the dataset, It is imbalance dataset in order to balanced the data by using under sampling 900 Yes is decreased to 100 Yes
-->Under Sampling is done only when we have a huge dataset
-->In most of the cases Under Sampling is not preferred as we are going to lose the data
10)Explain over sampling?
Random oversampling involves randomly selecting examples from the minority class, with replacement, and adding them to the training dataset.
-->In Over Sampling we wont decrease the records instead we increase the no of records
eg:-If we have 900-->Yes & 100-->No in the dataset, by using Over Sampling we try to increase the 100-->No to 900 No
-->Over Sampling is the most preferred method if we have small dataset
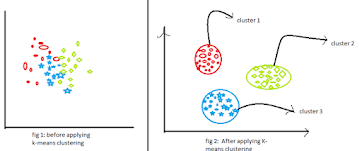
11)Explain K Means clutering?
K Means Clustering:-
K-Means is a technique for data clustering that may be used for unsupervised machine learning. It is capable of classifying unlabeled data into a predetermined number of clusters based on similarities (k).
-->The K-means clustering algorithm computes centroids and repeats until the optimal centroid is found.
-->In this method, data points are assigned to clusters in such a way that the sum of the squared distances between the data points and the centroid is as small as possible.
12)What is cross validation?
-->The mean of accuracy of all 5 experiments is calculatted i.e is only called as cross_val_score.
13)What is curse of dimensionality?


Comments
Post a Comment